Copyright © Panorama Group 1991 - 2024

In KB "Panorama" the agrarian geoinformation system "Workstation of agronomist" version 14.0.1.6 has been developed. The new version adds a mechanism for updating cartographic data from files of various types.
Due to the lack of control over agricultural operations, many agricultural producers lose their crops and profits. Mistakes are made at all stages of growing crops: from improper soil preparation, fertilization, sowing and vegetation and finishing by untimely or poor-quality harvesting. "Workstation of agronomist" implements the automated agroscouting technologies, allows you to import spatial and attributive information from Excel, DBF, TXT, CSV files and update existing maps of farmland on its basis. Thanks to the ability to save the settings, the operation of entering or synchronizing data can be easily carried out on a regular basis.
The set of programs "Workstation of agronomist" is an automated workstation of an agronomist based on the and an additional module "Complex of agronomical tasks". The software tools included in the complex include the necessary set of tools for creating and editing electronic maps, and also conducting a sectoral database of agricultural land. In addition, the program allows you to process data from satellite monitoring of fields, connect external data sources from the Internet, form thematic cartograms of fields and reporting documents using customizable templates.
Conducting passports of fields is carried out in structure of information base the , which allows the joint use of these products. Multi-user access, separation of rights, data encryption and load scaling are provided by means of the . The web application provides remote access to the agricultural enterprise management system using a web browser.
GIS of an agricultural enterprise, built on the basis of geoinformation systems of KB "Panorama", allows companies to keep a long history of their fields with photographs, descriptions and reporting. Digital data provide identification and solution of the problem, give forecasts of plant development and yield, taking into account the characteristics of the fields. Correction of agricultural technologies is possible both at the planning stage and during field work. Agroscouting, in addition, allows you to organize effective and fast communication between managers and agronomists.
The new version of the program is available on the website in the section.


In KB "Panorama" the version 14 has been developed. The new version adds the ability to automatically build maps of land holdings using the service.
The service uses a neural network to decrypt land plots and determine the boundaries of the contours of agricultural land. Information processing is performed on the local territory bounded by the polygon indicated on the map. Building a vector model of working areas of arable land in GeoJSON format is carried out on the basis of automatically selected actual data of average (10 m/px) and high resolution (1.2 m/px). The resulting maps of farmland have an accuracy comparable to the manual work of specialist-cartographers, but are created in much less time.
On the basis of the digital model of farmland, all agrotechnical calculations performed by the program are carried out: conducting passports of fields, building thematic cartograms, obtaining vegetation indices, maps of heterogeneity and need for nitrogen, calculating the application of fertilizer doses, and others.
"Workstation of Agronomist" is included into the line of agricultural GIS KB "Panorama", which also includes , Panorama AGRO Service and . The combination of these products with each other, as well as their combination with the and , allow, depending on the specified tasks, to configure corporate and regional agricultural geographic information systems of any complexity.
The new version of "Workstation of Agronomist" and other products of the company can be from our website.


In KB "Panorama" the version 13.6.6 has been developed. The new version adds support for working with Earth remote sensing data from the , created by the - IKI RAS in cooperation with LLC "IKIZ".
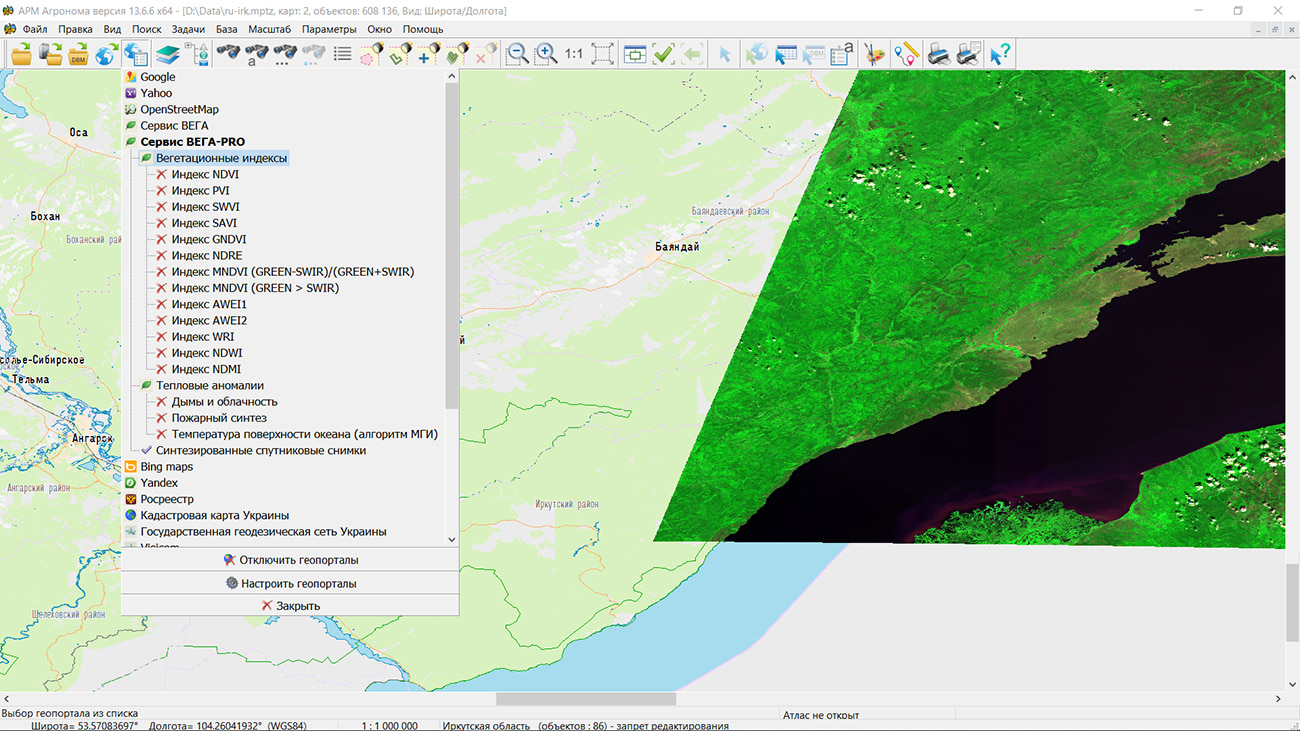
VEGA-PRO is a professional information service that provides access via the WMS protocol to archived and up-to-date data, daily updated satellite images in natural colors and thematic products based on them for analyzing the Earth's surface and monitoring renewable biological resources. The service provides data obtained from satellites LandSat, Sentinel, MODIS, TERRA, KANOPUS, METEOR, RESOURCE and others. A full description of the service's capabilities is available in the documentation.
As part of the "Workstation of agronomist", the service is available in the form of geoportals with layers of coverage based on satellite images in natural colors, a large number of different vegetation indexes and thematic products: smoke, fires, temperature of ocean surface. A layer of coverage with images in natural colors can be used in tasks of monitoring the Earth's surface, for example, for assessing forest and land resources. The images clearly show the change in the forest area caused by fires, deforestation or destruction of the timber stand, as well as the overgrowing of agricultural lands with forests due to their underutilization.
Vegetation indexes are numerical indicators of the quantity and quality of biological resources, calculated on the basis of satellite images. Depending on the type, the indexes can be used in the tasks of assessing the health of vegetation, predicting yields, or determining the effectiveness of fertilization. Indexes NDVI, GNDVI, PVI, SWVI, SAVI, NDRE, MNDVI, AWEI, WRI, NDWI, NDMI are available for viewing.
Thematic anomalies provide information on fire and smoke based on multispectral satellite imagery. "Workstation of an agronomist" provides data content management for all layers from the VEGA-PRO geoportal by using the tools of filtering the source images by date of shooting and total cloud cover.
Access to the service is provided by username and password or by an API access key. The options for providing access are described in the documentation on the service website.
The new version of the program is available on the website in the section.


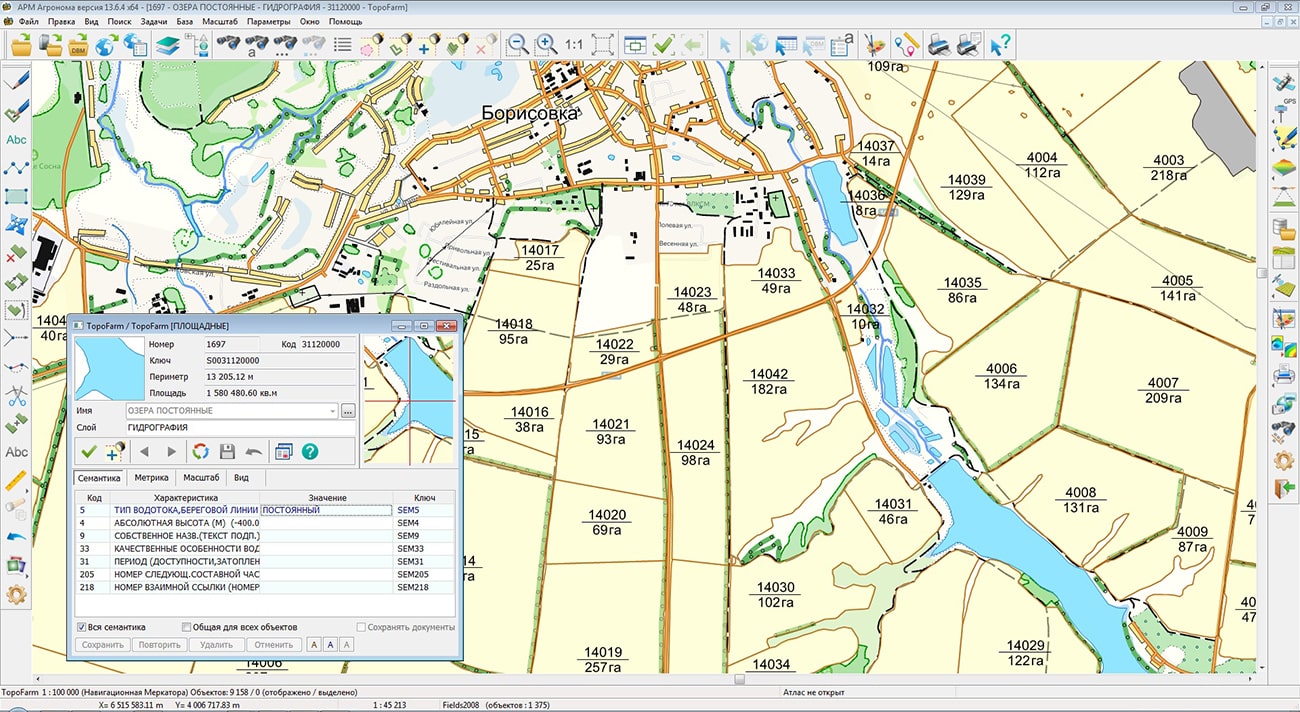
In KB "Panorama" the version 13.6.4 has been developed. In the new version, the "Open map from database" mode has been improved. In the dialog "Parameters of spatial DB view" the list of supported DBMSs has been expanded: PostgreSQL with PostGIS extension, Oracle with Oracle Spatial extension, Oracle with ArcSDE extension, Microsoft SQL Server. The DBMS access settings are saved in the DBM file, including the method and parameters of connecting to the database, the composition of displayed and edited objects, the list of semantic characteristics (attributes) of objects. Direct reading of databases for personal use and collective work with DBM layers located on the is supported.
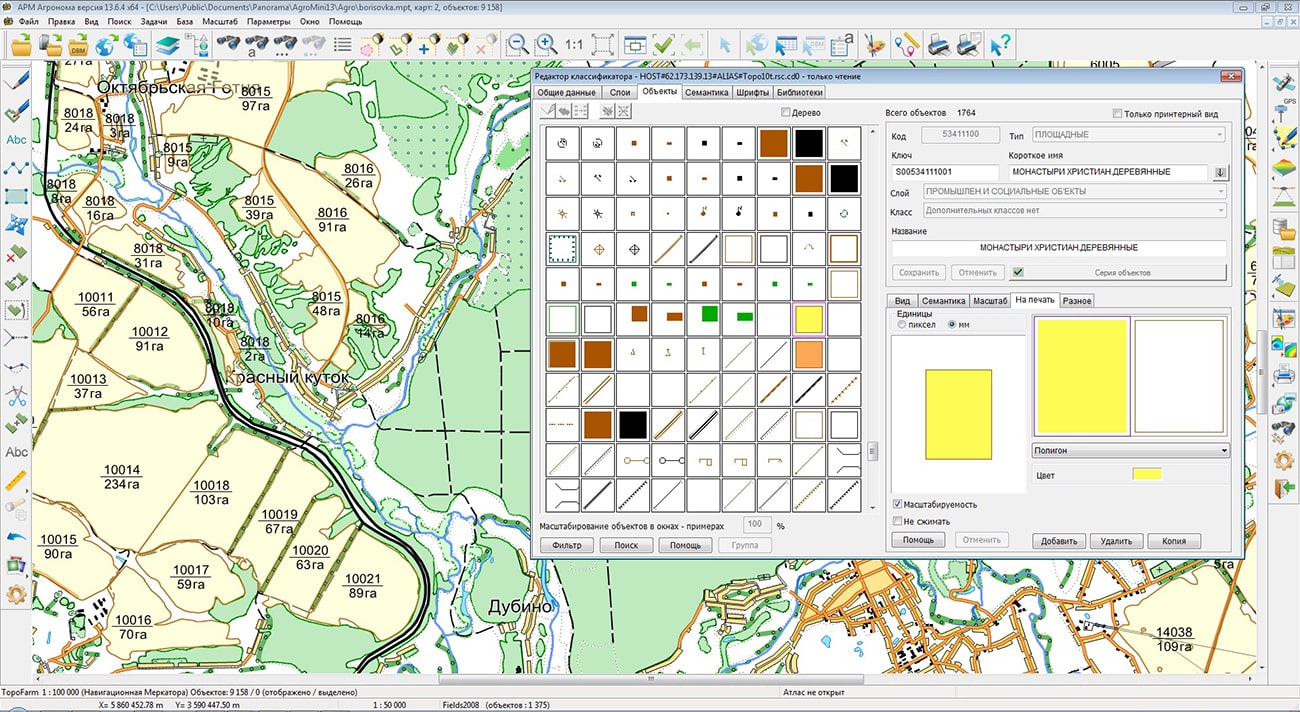
"Workstation of agronomist" provides display and editing of spatial databases in cartographic conventional symbols. To display combined vector signs containing several elements, including text, the "Editor of vector sign" has been improved. Tools for displaying polygons with a point sign in its center have been developed. For this, a new property of objects "Polygon with a point" has been added in the "Classifier Editor". For objects with this property, when creating and editing an object, or when sorting, a subobject with one point in the center of the polygon is automatically created. For example, when displaying a contour of an agricultural land in its center, you can automatically display the field number or a conventional symbol corresponding to the crop being grown. The position of the point mark can be corrected by means of the "Map Editor".
To display the result of an analytical or calculated expression, the list of mathematical operations for describing the semantics-formula has been expanded. The use of mathematical expressions (formulas) has been expanded that include various mathematical operations on the values of the object semantics and its measuring properties (length, area). As the mathematical operations there are supported the ABS, ARM, SIN, COS, TG, CTG, MIN, MAX, POW2, POW3, SQRT2, SQRT3, LOG, LOG10 and others. The value of the semantics-formula is automatically calculated when updating the coordinates or the values of semantics included in the expression (formula) and can participate in the formation of the symbol of the object through a series of objects or on the basis of programmable signs.
Tools for entering expressions and formulas used for selection of objects according to the conditions of one or several formulas (expressions) have been added into the "Object Search" dialog. For example, for the semantics (code 123), containing the amount of saltpeter applied in tons, it is necessary to select the contours of arable land, where from 40 to 50 kg of nitrogen is applied per hectare. Since the area of the plot (S) is calculated in square meters, and ammonium nitrate contains 34.5% nitrogen, the formula will look like: "#123*1000*0.345/(S/10000)". For selection by boundary conditions, you need to set two expressions, where 40 and 50 are specified as boundary values. To increase the speed of searching for objects by semantics, the indexing of semantics values is implemented using polynomial hashing methods. The speed of searching and selecting objects is increased on an average in 1000 times. To view and make changes into the values of the semantics of the selected objects, the mode "Editing semantics of the list of objects" has been improved. For convenience and acceleration of work, the ability to copy and paste semantics values with use of clipboard has been expanded.
In the mode "Search by cadastral number or address", the possibility of a selecting a source of search has been added: by a map or in Rosreestr. When using the search in the Rosreestr, the information found at the specified cadastral number or address is displayed in the "Information from State Real Estate Cadastre" dialog. If you have an access key to the Yandex.Maps API geocoder, the map is moved to the center of the found object.
Import of graphic files and matrixes of heights from GeoTIFF format has been improved. Due to the use of multi-threaded processing on a multi-core processor, the task execution time has been reduced by 3-5 times. There is added the analysis of tags containing information about the coordinate system GSK-2011 and PZ-90.11. When importing rasters and matrices, the loading of the data pyramid from the KMZ format has been added. KMZ archive can contain a KML file and a set of GeoTIFF files containing either a raster image or terrain elevation data. The KML file contains a description of the raster (matrix) data parameters - file names and coordinates, as well as the priority of their drawing. As a result of import from a KMZ file, a set of RSW or MTW files is formed, combined into an MPT project. An MPT project contains a list of rasters (RSW) or matrices (MTW) and file visibility limits according to the "Draw Order" parameter.
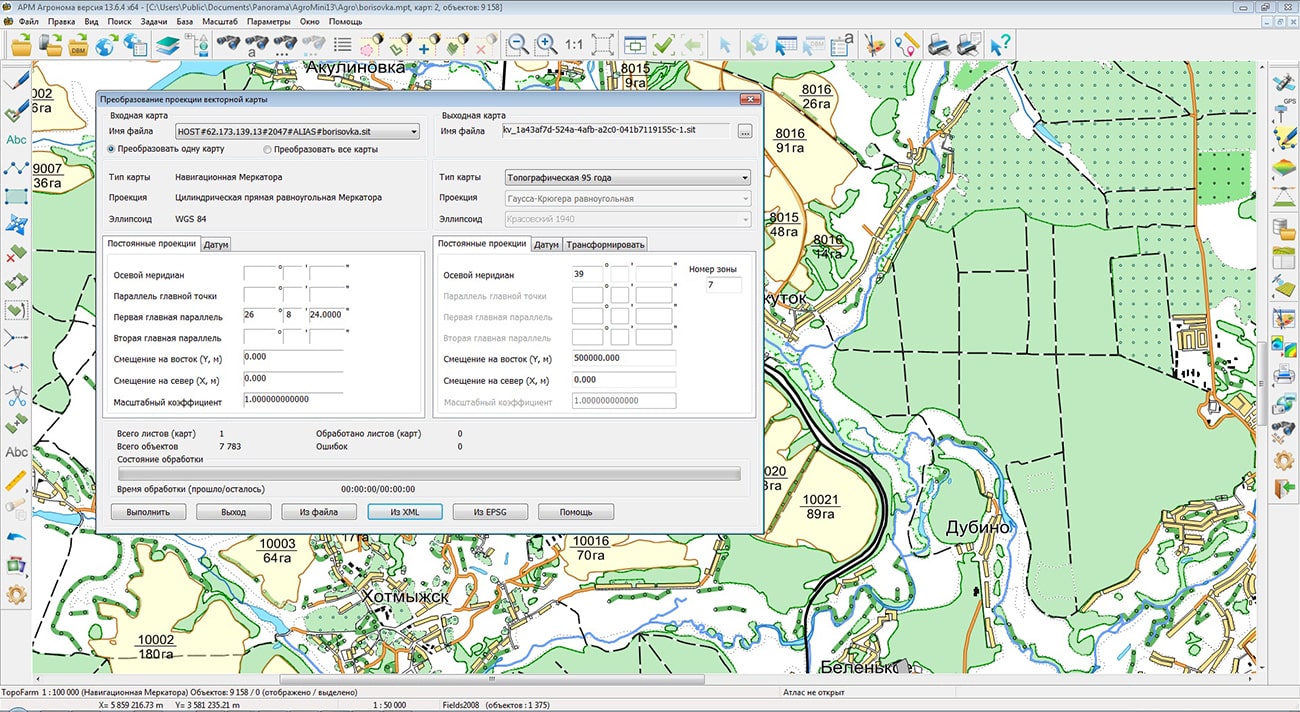
The program accelerates the transformation of vector maps into a given coordinate system by 4-6 times by means of the "Standard transformation" task and "on the fly" when adding maps in different coordinate systems.
The new version of the program is available for download in the section.


In KB "Panorama" the version 3.0.1 has been developed. In the program the new version of the map editor has been implemented. The new editor provides a wide range of functions and tools for editing the metrics and semantics of objects on the map of agricultural land and objects of an infrastructure. In this case, the data can be represented both as a file of a digital map and as a table in the spatial database.
The editor user interface is displayed in a separate window for a better overview of the map. It allows you to create new, modify existing map objects, perform actions on a group of objects. Operations are performed in a web browser and the result is uploaded to the server. Use the "View" panel to assign or change an object type. The object type can be set without interrupting the current editing operation. To do this, just select the appropriate icon in the "View" panel. Images of objects views are displayed as a legend (tree) or as a layout of objects (table).
For fast creation of objects the editor uses templates of objects. Templates of objects - the graphic list of often used types of map objects. When a template is selected, the editor automatically switches to the mode of creating an object of the specified type. The editor informs the user about the actions being performed: changing the type of an object, deleting, changing attributes and other operations on objects. The information is recorded into the map event log, which can be viewed.
The editor implements support for graphic objects, without selecting a conventional symbol from the map classifier file. Ability has been added to create an arbitrary visual representation of geographic objects. Users can define the parameters of the appearance of lines and areas: color, transparency, thickness, line type, select hatching, fonts and their design for text. The customized visual representation of the object is saved as a style and can be used repeatedly.
In the new version of GIS WebServer AGRO, the user and administrator interface of the application has been updated. The new tools have been added, allowing to minimise and change the interface of the main map window. There is implemented the ability to display map controls in the side panel, which is located to the left or to right of the map and provides a convenient interface for managing the toolbox.
The structure and interface of the administration module has been changed. In the module the possibility of conducting projects was added. Projects in GIS WebServer AGRO are created automatically and linked directly to agricultural enterprises described in the agrarian database, customized by means of .
GIS WebServer AGRO uses the cartographical service as a source of spatial data. Synchronization of cartographic information described in the "Panorama AGRO" database and information published on GIS WebService SE is carried out automatically. In the new version of GIS WebServer AGRO, the visualization of the map has been updated, drawing was accelerated and the layout of wms layers has been improved.
For collective work with data, digital maps of farmland and enterprise infrastructure are placed on the . Its use allows you to synchronize the work of the desktop "Panorama AGRO", web applications and mobile clients. Desktop applications such as , "Workstation of agronomist" and others can be connected to the server. It allows the mobile clients working through web to process the same data together with desktop clients.
You can get acquainted with an example of work of GIS WebServer AGRO on the page of the demo project . The new version of the program is available on the website in the section.


 Mobile version
 Full version